Stop Guessing and Start Whispering!
I recently moved to a new house and had to rebuild my antenna setup from scratch. Like most people, I checked the SWR to make sure my radio was working well, but a good SWR only tells part of the story. It doesn’t show where your signal actually goes after it leaves the antenna.
This gap inspired me to create a free tool that shows real-world antenna performance using WSPR data.
You can try it right now at: wspr.bsdworld.org
What is it?

If you’re familiar with WSPR1, you already know it’s one of the best tools we have for studying propagation. Thousands of stations around the world listen for extremely low-power signals and upload reception reports to a global database.
My tool takes raw WSPR data and turns it into a clear, practical performance report for your station. Instead of guessing or relying only on simulations, you get a visual dashboard that shows things like:
- Maximum Distance: How far your signal is actually reaching.
- Distance Statistics: Where most of your signal is landing, which is the real “sweet spot” of your antenna.
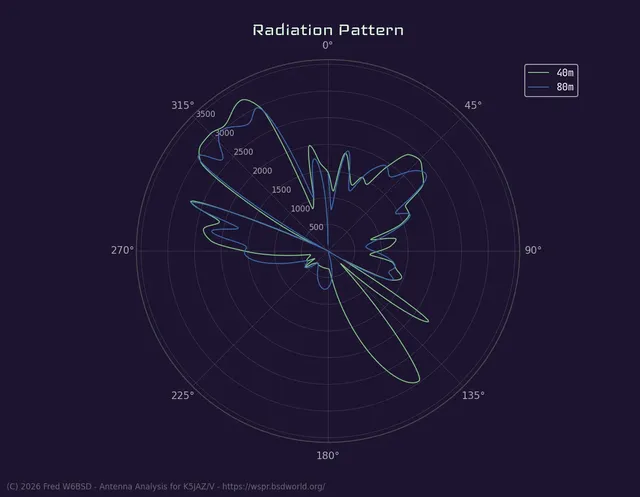
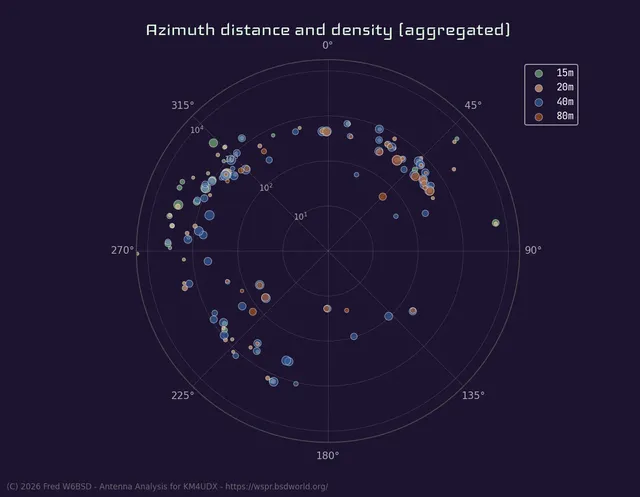
- Azimuth / Directional Analysis: Is your dipole really favoring North to South? The azimuth plots make it clear.
- Signal Distribution: Graphs that help reveal skip zones and coverage gaps.
If you want to see what the output looks like, check out this example report for M0MBO.
How to Use It (It’s dead simple)
You don’t need to install anything new or be a data nerd. The whole process takes three steps:
- Transmit WSPR: Use WSJT-X, a Zachtek, a WSPRlite, or any WSPR-capable transmitter. Let it run for a few hours, or for a full 24-hour cycle if you want the best results.
- Go to the site: wspr.bsdworld.org.
- Enter your callsign: Choose the band you’re testing, and hit Analyze.
The tool pulls the data from the global WSPR database and generates a custom report just for you.
Why should you care?
This tool is especially helpful for A/B testing. If you’re wondering whether your new EFHW is actually better than your old G5RV, run WSPR on one antenna for a day, generate a report, then swap antennas and compare the results. You’ll see how the radiation pattern and distances change in the real world, not just in NEC2 plots.
It’s also very useful for “stealth” setups. If you’re using an attic antenna, a disguised wire, or any compromised setup, this tool lets you see if your signal is really getting out or just heating the roof.
Give it a spin!
This tool is completely free and built by a fellow ham for the community. If you use it to improve your station or uncover something interesting about propagation, I’d genuinely love to hear about it.
I look forward to hearing you on the air with your improved antenna, or at least seeing you in the logs!
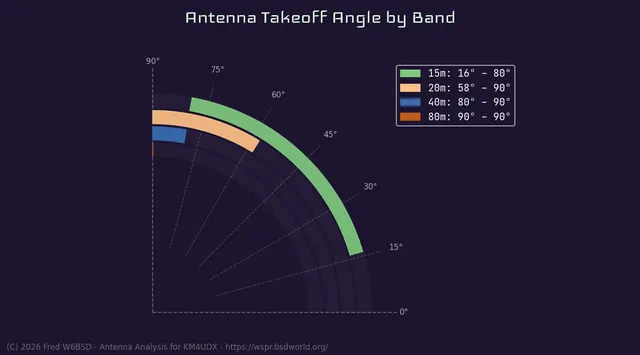
Example of transmission pattern
This is examples of graphs generated by wspr.bsdworld.org