It's important to keep an eye on space weather for effective communication, especially for a ham radio operator. Solar activity can have a significant impact on how radio waves travel. I'll share some essential graphs to monitor from my website: http://bsdworld.org/.
Note
The graphs provided on this page are examples. Click on each graph to view the most current data.
D Layer Absorption
The D-Layer absorption graph shows the high-frequency (HF) radio signal absorption in the Earth's D ionosphere region almost in real-time. This region is particularly susceptible to solar X-rays, which increase ionization and absorption, leading to potential radio blackouts.

Click on the graph for the current data
During solar flares, the increased X-ray emissions cause the D region to become more ionized, leading to higher HF signal absorption. This can result in sudden loss or degradation of radio communications, especially during the day. High absorption levels indicate poor signal propagation, leading operators to adjust frequencies or communication schedules.
Solar X-ray Flux
The Solar X-ray Flux graph shows the intensity of the sun's rays in almost real-time. These measurements are crucial for detecting solar flares, which can cause sudden ionospheric disturbances.

Click on the graph for the current data
Solar flares cause immediate and severe disruptions in HF communication by rapid ionization in the ionosphere. Depending on the flare's intensity, these disturbances can affect radio propagation for several minutes to hours. By monitoring the solar X-ray flux, operators can quickly identify flare events and anticipate possible communication disruptions.
Solar Cycle Progression
This graph tracks the sunspot number and the F10.7 cm radio flux, both key indicators of solar activity.
Click on the graph for the current data
When solar activity is high, indicated by increased sunspots and F10.7 cm radio flux, it usually results in better HF propagation by improving ionospheric conditions. However, it also increases the probability of solar storm-related geomagnetic disturbances and radio blackouts.
Note
The graph Daily Flux Index shows the F10.7 cm flux in more detail. The solar cycle lasts about 11 years and significantly influences HF radio propagation. The graph Sun Spot Number History shows where we are in the solar cycle.
Proton Flux
Proton Flux refers to the flow of high-energy protons emitted by the sun, often during solar storms and coronal mass ejections (CMEs). CMEs can lead to geomagnetic storms that disturb the Earth's magnetosphere and ionosphere, deteriorating HF radio propagation and increasing noise levels. The intensity and duration of these storms can vary, but their impact on communication can be substantial.
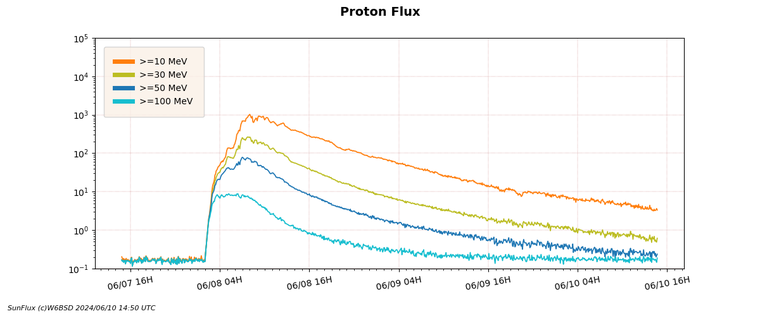
Click on the graph for the current data
Monitoring CME activity allows operators to prepare for potential disruptions. Information on the size, speed, and direction of CMEs can help predict the timing and severity of geomagnetic storms, enabling better planning for communication needs.
The ENLIL simulation is also helpful in estimating the strength of CME emitted from the sun and determining when it will reach the Earth's atmosphere. The Solar Wind graph is also interesting to monitor during a CME. It will provide information on the quantity and speed of the plasma cloud giving an idea of the intensity of the CME.
Note
The plasma released by the Sun during a solar flare takes approximately 48 hours to reach Earth. Upon arrival, it can cause the captivating phenomenon of the aurora borealis, or northern lights, while also posing a risk of disrupting radio communications.
Conclusion
The website bsdworld.org provides numerous graphs related to solar and band activity. By regularly monitoring these graphs, ham radio operators can stay informed about space weather conditions and propagation. This enables them to anticipate and adapt to changes in HF radio propagation.